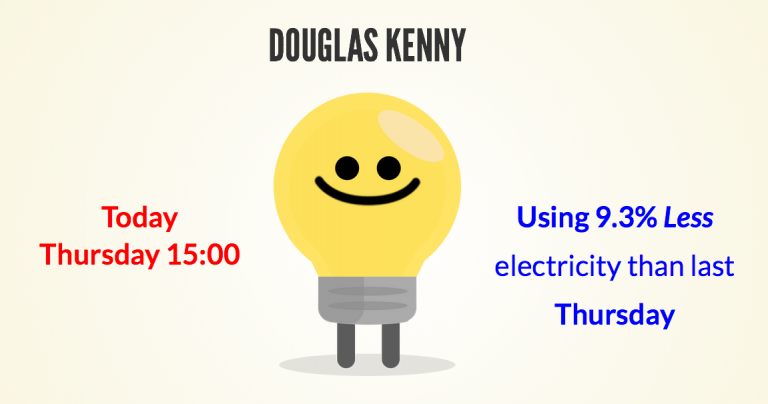

The Real-Time Energy Display Behaviour Research Project (ubc-realtime-energy.com) is a student-led university collaboration with UBC’s SEEDS Sustainability Program, Sustainability & Engineering, and the Department of Psychology.
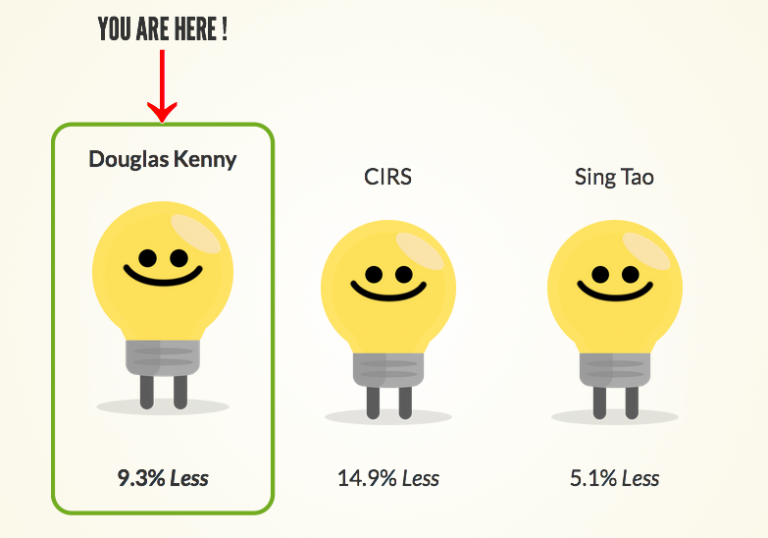
Psychology’s Kenny building is being compared to CIRS and the Sing Tao building:


To compare seasonal differences and fluctuation in electricity consumption, the behavioural research project will be displaying and monitoring energy use over the course of a year. The displays will also share tips for energy conservation behaviours.


Jiaying Zhao
Psychology professor Jiaying Zhao, Principal Investigator of the Lab, says that a challenge for conservation is that people are often unaware of the amount of resources being used. “To address this issue, our research uses real-time visual feedback to reduce electricity consumption in campus buildings,” says Zhao, a Canada Research Chair in Behavioural Sustainability. “This project is another is example of how the lab uses psychological research to design behavioural solutions to address sustainability challenges.”
What are the displayed energy readings?
The percentage change of electricity consumption presented on the screen is derived from two energy values, both of which are electricity consumption averages that are updated every 15 minutes.
- Current Energy Consumption: The first value is the current electricity consumption in the building averaged between now and the last 24 hours. This is a moving average updated every 15 minutes.
- Reference Point: The second value is the reference point which is the average electricity consumption during the same time period last week (between the same time last week and the prior 24 hours). This reference point shifts with the current time point every 15 minutes.
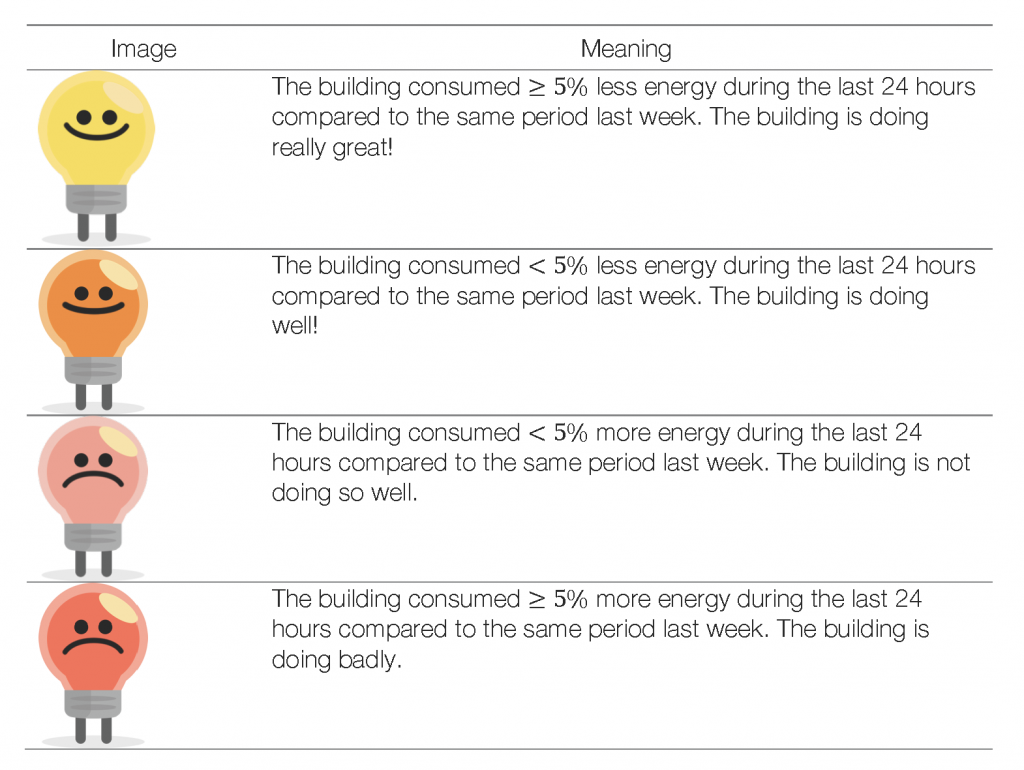
Image guide


Related
- Prof. Jiaying Zhao’s research inspires a new product to change water-use habits
- Lab of the Month: Bridging Sustainability and Psychology with Dr. Jiaying Zhao
- UBC Psychology prof. Jiaying Zhao is exploring how your environment affects your happiness
- UBC Psychology research a feature story in UBC’s 2014/15 Annual Report


